December 2020 Pension Finance Update
December gave us one more turn of the screw from extraordinary 2020 stock markets, pushing pension sponsors into the black for the year.
December gave us one more turn of the screw from extraordinary 2020 stock markets, pushing pension sponsors into the black for the year. Both model plans we track[1] gained ground last month, with Plan A adding 3% and Plan B gaining 1% during the month. Plan A ended the year with close to a 2% gain, while Plan B managed a 1% gain during 2020:

Assets
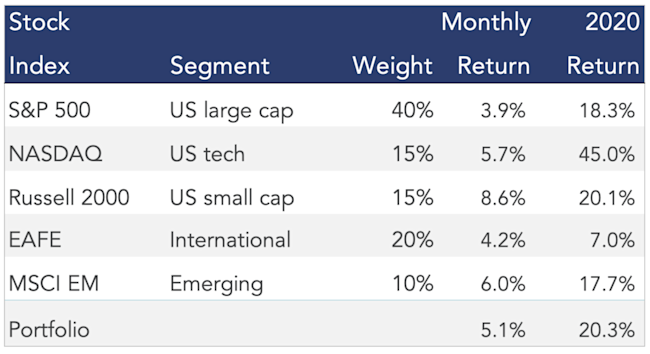
Stock markets saw another strong month in December, capping a stunning reversal from lows seen in March. A diversified stock portfolio gained 5% in December, ending the year with returns of 20%.

Treasury yields and (to a lesser extent) corporate bond yields edged up slightly during December, producing flat to modestly negative returns on bond portfolios for the month During the year, credit spreads executed a round trip, blowing up in March before returning to “normal” levels by year-end. Interest rates fell 0.75% during 2020, producing returns on bonds of 10%-12% for the year, with long duration bonds producing the best returns.
Overall, our traditional 60/40 portfolio gained 3% in December, ending the year with a 15% return, while the conservative 20/80 portfolio added 1% last month, ending 2020 with a return of 12%.
Liabilities
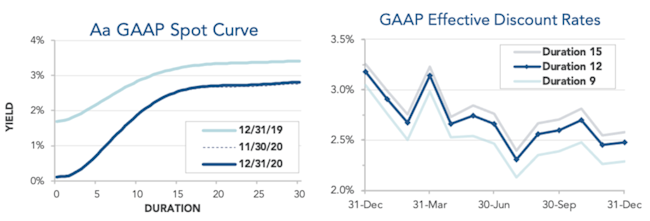
Pension liabilities (for funding, accounting, and de-risking purposes) are driven by market interest rates. The first graph below compares our Aa GAAP spot yield curve at December 31, 2019 and December 31, 2020, and it also shows the decrease in the curve last month. The second graph below shows our estimate of movements in effective GAAP discount rates for pension obligations of various duration during 2020:

Corporate bond yields rose a couple basis points last month, leaving liabilities flat to down less than 1% for the month. For 2020 in total, liabilities increased 11%-15% for most plans, with long-duration plans seeing the largest increases.
Summary
It’s not how you start; it’s how you finish. For pension sponsors, 2020 was a harrowing experience, with pension funded status plunging early in the year and plans spending most of 2020 significantly underwater before seeing the stock market recovery propel them into positive territory by year-end. The graphs below show the movement of assets and liabilities for our two model plans during this extraordinary year:

Looking Ahead
Pension funding relief has reduced required plan funding since 2012, but under current law, liabilities will increase substantially over the next three years. Plans that have only made required contributions in the past can expect significant increases in required contributions over the next couple years.
The rebound in pension finances since March has reduced the likelihood of additional pension funding relief legislation. There is some chance we get more relief in 2021, but the recovery we have seen this year may make that less likely.
Discount rates were close to unchanged last month. We expect most pension sponsors will use effective discount rates in the 2.2%-2.7% range to measure pension liabilities right now.
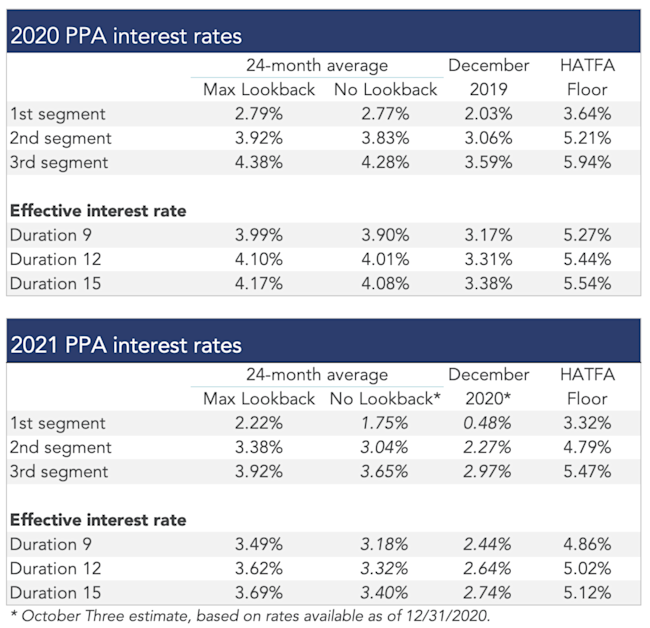
The table below summarizes rates that plan sponsors are required to use for IRS funding purposes for 2020, along with estimates for 2021. Pre-relief, both 24-month averages and December ‘spot’ rates, which are still required for some calculations, such as PBGC premiums, are also included.

[1] Plan A is a traditional plan (duration 12 at 5.5%) with a 60/40 asset allocation, while Plan B is a largely retired plan (duration 9 at 5.5%) with a 20/80 allocation with a greater emphasis on corporate and long-duration bonds. We assume overhead expenses of 1% of plan assets per year, and we assume the plans are 100% funded at the beginning of the year and ignore benefit accruals, contributions, and benefit payments in order to isolate the financial performance of plan assets versus liabilities.
