PBGC’s financial position – FY2018 annual report
On November 16, 2018, the Pension Benefit Guaranty Corporation released its Fiscal Year 2018 Annual Report, showing an $11.2 billion improvement in the multiemployer (ME) program and a $13.4 billion improvement in the single employer (SE) program. The single employer program, no longer in deficit, now has a $2.4 billion surplus.In this article we discuss what PBGC’s FY2018 Annual Report tells us about the financial condition of and prospects for the single employer program and briefly discuss the financial condition of the multiemployer program.
On November 16, 2018, the Pension Benefit Guaranty Corporation released its Fiscal Year 2018 Annual Report, showing an $11.2 billion improvement in the multiemployer (ME) program and a $13.4 billion improvement in the single employer (SE) program. The single employer program, no longer in deficit, now has a $2.4 billion surplus.
In this article we discuss what PBGC’s FY2018 Annual Report tells us about the financial condition of and prospects for the single employer program and briefly discuss the financial condition of the multiemployer program.
FY2018 PBGC single employer program financial position
As noted, the net position of the PBGC single employer program improved by $13.4 billion in FY2018 – the second straight year of double digit “improvement.” Factors in this dramatic improvement included:
A $7.6 billion gain (a reduction in the value of liabilities) due to an increase valuation interest rates (compared to $2.2 billion in FY 2017).
Net premium income of $5.5 billion (compared to $6.7 billion in FY 2017).
Investment income of $1.5 billion (compared to $5.4 billion in FY 2017).
The story here is, briefly, that PBGC’s SE program liabilities went down by $7.6 billion (because of increases in interest rates), while the program received (positive) income of $5.5 billion in net premiums and $1.5 billion in investment income.
PBGC’s single employer program has, in effect, become a very profitable insurance company.
Premiums
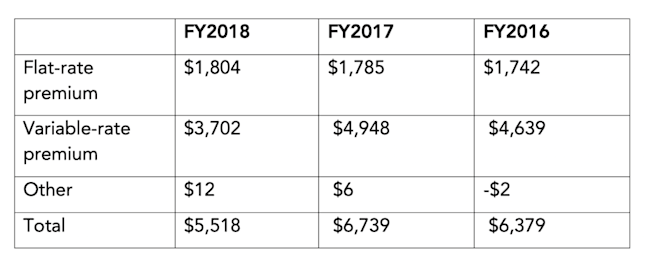
Because premiums are a major (and increasing) defined benefit plan sponsor expense, let’s break down PBGC’s single employer program net premium income for FYs 2018, 2017 and FY2016.
Table 1 PBGC SE program net premium income 2016-2018

The increase in flat-rate premiums is entirely due to the increase in the premium rate, from $69 to $74 per participant. Doing some crude math, these numbers imply a 1.5 million (nearly 6%) decrease in the number of participants covered in the single employer program. PBGC attributes the decrease in variable-rate premiums to “improved conditions on the plans’ underfunding.”
Clearly, as has been widely discussed, increased PBGC single employer program premiums have resulted in increased de-risking and risk transfer activity and increased plan funding, resulting in a reduction in the number of participants covered by the program and in the amount of plan underfunding.
“Levers” affecting the PBGC single employer program’s financial position
There are four “levers” significantly affecting the SE program’s financial position: (1) investment returns (asset performance); (2) the effect of interest rates on liability valuation (liability performance); (3) losses from completed and probable terminations; and (4) premium income.
Let’s consider items (1) and (2) – asset and liability performance.
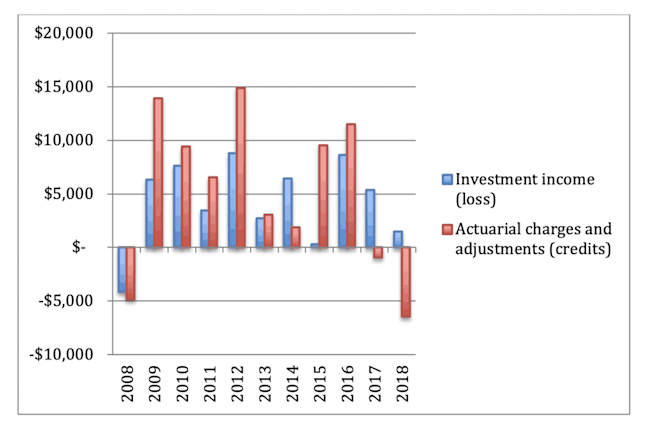
Chart 1 Performance of SE program assets vs. liabilities 2008-2018

(“Actuarial charges and adjustments” are a proxy for interest rates here. They are inversely related, that is, as interest rates go up, actuarial charges go down – generating a credit in both 2017 and, more dramatically, 2018.)
Overall this data is good news, notwithstanding relatively modest 2018 investment income. The “gains” PBGC sustained on its liability portfolio outstripped the reduction in investment income. That is, while investment income went down by $3.86 billion vs. 2017, actuarial gains went up by $5.5 billion.
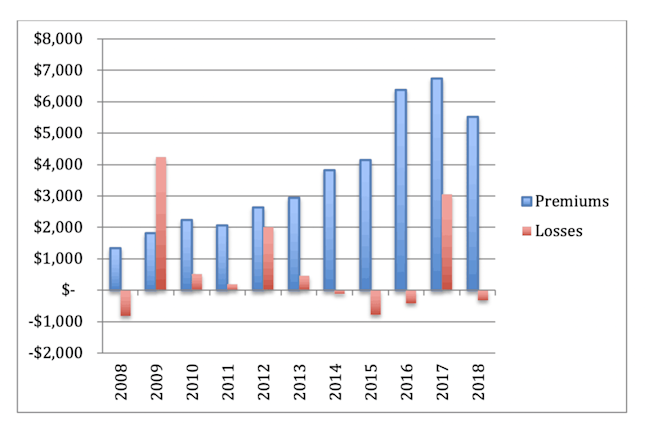
Chart 2 SE program losses and premium income 2008-2018

With respect to lever (3) – losses – these will be correlated somewhat with the business cycle (e.g., in 2009). There’s not much PBGC can do to manage this risk, other than to get a better understanding of its size and volatility.
The reduction in premium income (Lever (4)) reflects both increased derisking activity and improved funding. The latter (improved funding) is attributable to increased interest rates, asset performance and plan funding strategies explicitly aimed at reducing variable-rate premiums.
Solvency of the SE and ME programs
One can imagine scenarios – a major recession triggering large plan defaults and PBGC guarantees, a significant decrease in interest rates not accompanied by an offsetting increase in asset values – in which the trend for the SE program turns negative. But generally, it looks like the SE program is going to be in surplus for the foreseeable future, primarily because of increased (and increasing) premium rates. Anticipated interest rate increases (while obviously less predictable) may also increase PBGC’s single employer program surplus.
The outlook for PBGC’s multiemployer program – and many multiemployer plans – is, however, not so good. Notwithstanding the $11.2 billion improvement in the ME program’s net position, PBGC continues to predict that program insolvency “is likely to occur by the end of FY 2025.”
The Senate Joint Select Committee on Solvency of Multiemployer Pension Plans did not make its November 30, 2018, deadline for coming up with a legislative solution the multiemployer plan funding crisis. Senators Portman (R-OH) and Brown (D-OH) did, however, reaffirm their commitment to finding a solution, saying that they had made “significant progress.”
At least one proposal purportedly leaked from the committee includes a significant federal bailout of up to $3 billion a year.
Addressing the multiemployer plan funding crisis is likely to be one of the top policy concern in 2019.
* * *
We will continue to follow these issues.
