Retirement savings finance at the end of 2020
Bottom line: interest rates have stabilized since mid-Summer (near all-time lows) while asset performance has improved dramatically, leaving DB plans on-net slightly better off than they were at the beginning of the year. DC participants – who are generally (on average) younger than DB participants, with longer durations, and thus more affected by 2020 interest rate declines – did (on average) less well, notwithstanding strong asset returns.
We last discussed the effect of 2020 market turmoil on defined benefit plan finance and defined contribution plan retirement income in July. In this article we review those issues as of year-end 2020.
Bottom line: interest rates have stabilized since mid-Summer (near all-time lows) while asset performance has improved dramatically, leaving DB plans on-net slightly better off than they were at the beginning of the year. DC participants – who are generally (on average) younger than DB participants, with longer durations, and thus more affected by 2020 interest rate declines – did (on average) less well, notwithstanding strong asset returns.
Interest rate and asset performance
There has been little change in valuation interest rates since mid-2020, leaving them down about 75 basis points for the year.
Asset performance continued to improve since the March 2020 lows. Equities were down almost 25% at the end of March, but they ended the year up 20%. And declining interest rates produced returns of 10% or more on bonds for the year.
Of course, these same declining interest rates pushed pension liabilities up 11%-15% for the year, with longer duration plans seeing bigger increases.
On balance, as of the end of 2020, for a typical defined benefit plan, the gains on assets (marginally) outpaced losses (on the plan’s liability portfolio) resulting from interest rate declines.
Effect on funding
The following chart projects the funding interest rate through 2030.

PPA Effective Interest Rates, 2012-12/31/2020
Back at the beginning of 2019, we were projecting that market rates would be higher than HATFA rates as early as 2023. Because of 2020 rate declines, it looks like sponsors will, however, be “stuck with” lower HATFA 25-year average rates for the foreseeable future. As the chart shows, HATFA rates will, per the statute, begin to “ratchet down” by 5 percentage points per year beginning in 2021, resulting in lower valuation interest rates and higher liability valuations. 2024 liability measures will be 20%-30% higher than 2020 due only to those lower (statutory) valuation rates.
PBGC premiums
As we have discussed in the past, much DB funding policy is now driven by Pension Benefit Guaranty Corporation premiums. PBGC variable-rate premiums (VRPs) for 2021 will be determined based on 2020 funding. The net improvement in funding over 2020 will (marginally) reduce VRPs for affected plans.
Managing a DB plan’s premium liability, however, presents a number of complicated issues, which we have covered in detail, as follows:
We discuss specific strategies for reducing VRPs in our article Markets 2020 – effect on PBGC variable-rate premiums and strategies to reduce them.
A critical element for 2020 was the method used to value unfunded vested benefits (UVBs) for purposes of the VRP calculation – we discussed that issue in our article Measuring UVBs for variable-rate premiums – the alternative vs. standard method election.
We discussed lump sum de-risking and its effect on PBGC premiums generally (and on the sponsor’s balance sheet and funded status) in our article 2020 lessons learned – lump sum de-risking in the context of steeply declining interest rates.
And we provided a similar analysis with respect to risk transfer (“annuity de-risking”) in our article 2020 lessons learned – annuity settlements in the context of steeply declining interest rates.
Consequences for DC participants
One issue that we highlighted in 2020 was the consequence of declining interest rates for DC participants. In effect, interest rate declines represent an increase in the cost of retirement income; interest rate increases represent a decrease in that cost. Simple version: when interest rates go down, annuity income gets more expensive.
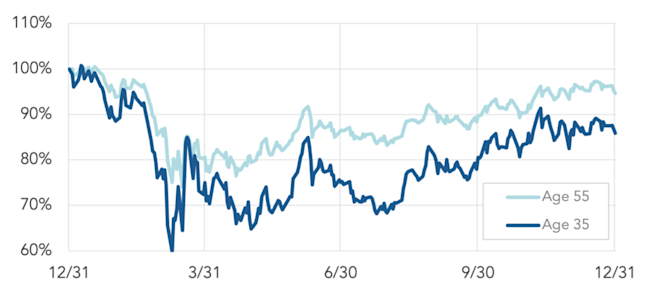
This issue becomes acute as DC participants approach retirement and need to begin thinking in terms of retirement income rather than just asset accumulation. And the relationship between interest rates and DC retirement income will be made explicit for participants when DOL’s interim final rule on lifetime income disclosure takes effect.To track the relationship between a DC participant’s asset and (lifetime income) liability portfolios, we tracked the effect of asset gains/losses and interest rate increases/declines over 2020 for two example participants (ages 35 and 55). The chart below illustrates that these participants ended 2020 with a net loss in their retirement income despite double-digit asset returns.

DC participant retirement income performance for 2020
We lay out our methodology for this illustration in detail in our earlier article. Very briefly, we assume each participant is at 100% of their retirement income goal as of the beginning of the year and then calculate the effects of asset returns and interest rate declines on retirement income for the year.
To repeat what we said in our earlier article, the consequences of interest rate declines – which account for the negative “retirement income performance” this graph charts – are more speculative for younger participants and more consequential for older ones.
* * *
We will return to these issues in 2021.
