Possible extension of MAP-21 interest rate stabilization
Lawmakers in Washington have a budget problem, and a small part of the solution being considered is, as we understand it, an extension of interest rate stabilization relief under 2012’s “Moving Ahead for Progress in the 21st Century Act” (MAP-21). The proposal is to extend the MAP-21 25-year average floor at the 90% level through 2016.
We thought it would be useful, in this context, to review where we are with MAP-21. We begin with a discussion of the (current) basic MAP-21 rules. Then we discuss MAP-21 rates and non-MAP-21 PPA rates for 2012, 2013 and 2014. Finally, we discuss how the extension of MAP-21 relief currently under consideration would affect plan valuations and (indirectly) funding.
Background
Interest rates matter for ERISA minimum funding because, under the Pension Protection Act (PPA), the amount an employer must contribute to a plan is (oversimplifying somewhat) the present value of plan liabilities minus plan assets (the funding shortfall) amortized over seven years. Generally, under PPA, valuation interest rates are determined using a corporate bond yield curve, averaged over 24 months and then broken down into three segment rates – short-, medium- and long-term. (Pinning down the “PPA rate” can get complicated, because the sponsor can elect to use a 24-month period ending on any of 5 months. For purposes of this article, we are simply going to use August as the ending month for all purposes.)
MAP-21 put a “floor” under the PPA rates, equal to the average of rates for the 25-year period ending in September of the preceding calendar year, multiplied by a percentage, as follows:
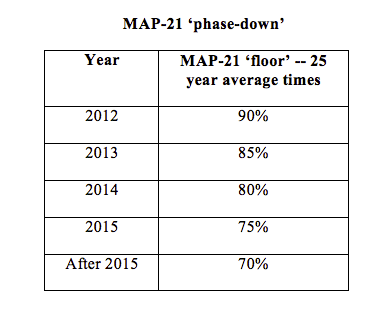
The calculation of the 25-year average is more complicated than it looks — it is actually a 25-year average of 24-month averages. And (to add more complexity), IRS used one method to calculate the average in 2012 and changed that method for years 2013 and after. To keep it simple (or at least simpler), in this article we’re just going to use the ‘bottom line’ numbers. (Note: because of the way MAP-21 rates are calculated, we already know rates for 2014.)
The MAP-21 floor allows sponsors to use higher interest rates than they would be able to under the PPA. Higher interest rates = lower liability valuations = lower minimum required contributions. MAP-21 was included in last year’s transportation bill as a ‘pay-for’ because reduced minimum contribution requirements = lower contributions = lower tax deductions = more revenues. Hence the continued appeal of proposals to relax funding in the larger context of the federal budget.
MAP-21 ‘dynamics’
Let’s note a couple of things about the way the MAP-21 interest rate floor changes. First, it changes once a year, unlike PPA 24-month average rates, which (in effect) change every month. Second, the floor will go down (in effect, be less of a floor) each year for the foreseeable future. There are two reasons for this. First, every year the 25-year average ‘moves forward’ one year, and as a result a very high interest rate year (from the late 1980s) is subtracted from the 25-year average, and a very low interest rate year (e.g., 2013) is added. Second, until 2015, the percentage multiplier goes down.
Interest rates for the last 25 years and since 2012
To get a feel for what’s going on with the MAP-21 floor, it’s worth taking a look at where interest rates have been. The following chart shows the 24-month average segment rates under PPA over the past 25 years:
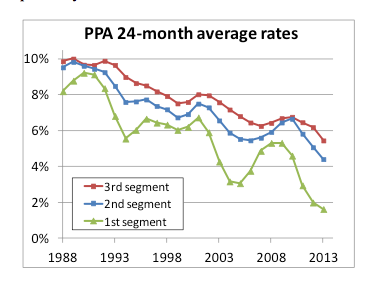
Looking at this chart, it’s pretty obvious why averaging interest rates over 25 years provides a ‘floor’ (relative to a 24-month average). Interest rates have trended down for most of those 25 years.
The next chart shows interest rates for 2012-2013 – the period MAP-21 has been in effect – looking at the monthly average for the key PPA second- and third-segment rates:
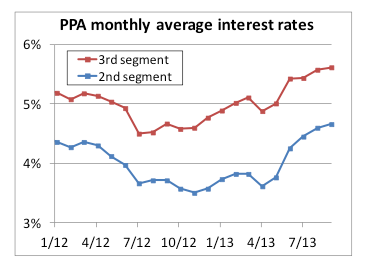
Looking at this chart we can see that, over the past year, interest rates have gone up about 1%. As rates go up, the MAP-21 ‘floor’ becomes less significant. But remember, this is a floor relative to a 24-month average – 24-month average rates have not (because they are an average) gone up the way these spot rates have. As we noted in our recent article MAP-21 and DB plan finance – Looking ahead to 2014, the MAP-21 floor will still be significantly reducing liability valuations (relative to pre-MAP-21 rules) in 2014.
2012, 2013 and 2014 rates — current (PPA+MAP-21) rules
Looking at short-, medium- and long-term segment rates under the PPA and MAP-21 is a little awkward. It’s easier to understand what’s going on with MAP-21 by looking at ‘effective’ rates. For the table below we blend segment rates to create a single rate that would apply to a plan with typical, ‘medium duration’ demographics – 5% short-term, 60% medium-term and 35% long-term. With this approach we can compare a single PPA rate to a single MAP-21 rate and show the difference.

As this table shows, while the MAP-21 floor has gone down over the period 2012-2014, so has the PPA 24-month average. As a result, relative to the valuation interest rate this typical plan would have been using under the PPA, MAP-21 has increased the valuation rate by around 150 basis points in each of the three years 2012, 2013 and 2014. That increase generally reduces the value of liabilities by around 18%.
For example, assume this plan has $100 million in liabilities and $79 million in assets under the PPA rules without the MAP-21 floor. Under those rules this plan would be 79% funded and subject to all the restrictions, etc. that apply to a plan less than 80% funded. Applying the MAP-21 floor, this plan will be 96% funded ($79 million divided by $82 million ($100 million minus 18%) = 96%).
Extension of MAP-21
The proposal being discussed as part of a package to end the shutdown would, as we understand it, revise the ‘phase-down’ schedule as follows:
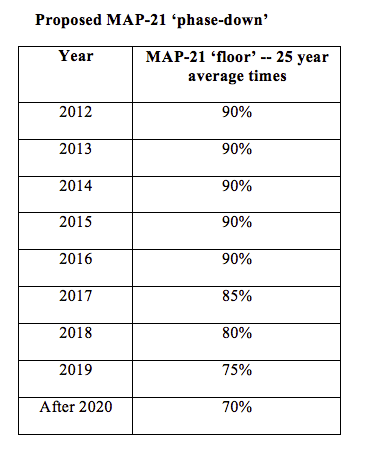
The table below shows the effect of using a 90% MAP-21 multiplier for years 2012, 2013 and 2014 (years for which we have actual rates).
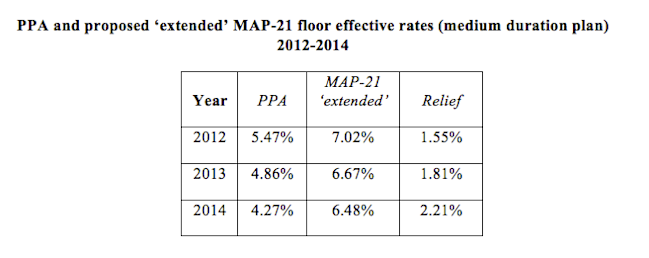
Over the period 2012-2014, the difference between the PPA rate and the MAP-21 rate actually goes up significantly. The 222 basis point increase in 2014 reduces liabilities, for our typical plan, by 27%. So the plan goes from being 79% funded (under the pre-MAP-21 rules) to being 108% funded ($79 million divided by $73 million [$100 million minus 27%] = 108%).
Projection
We already know what 2013 and 2014 would look like under the proposed extension of MAP-21. Let’s consider what may happen beyond 2014.
The following chart calculates a single effective rate for our typical pension plan through 2020 based on (1) PPA 24-month average rates, (2) the current MAP-21 floor and (3) the proposed extension of MAP-21 rates. (Our projections are based on rates through October 2013, assuming no future change in rates).
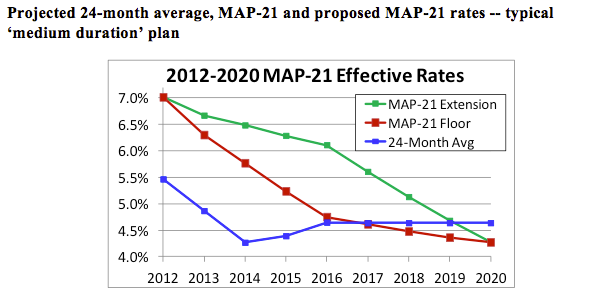
Projected 24-month average, MAP-21 and proposed MAP-21 rates — typical ‘medium duration’ plan
Under these projections, current MAP-21 interest rate relief dwindles after 2015. The extension is expected to provide an additional three years of relief, through 2018. Of more immediate significance, however, is the additional relief sponsors would enjoy over the next few years (2013-2015).
* * *
Clearly, the proposal would provide significant additional interest rate relief — and greater funding flexibility for sponsors — for the period 2013-2019. Of course, unless interest rates increase, this sort of relief only defers funding. At some point, the shortfall in funding will have to be made up. Under the proposal, during the period 2013-2019, the plan will ‘look,’ for ERISA minimum funding purposes, more well-funded than it actually is (based on market interest rates). But, unless those actual, market interest rates go up significantly, by 2020 (when, in effect, the floor will go away) the real shortfall will remain and will have to be funded.
The situation in Washington remains unclear, with another potential budget showdown set for January. Whether extended MAP-21 interest rate relief as part of a bargain, grand or small, is anybody’s guess. But such an extension is in the Congressional budget ‘toolkit’ as a politically viable ‘pay-for.’
