November 2016 Pension Finance Update
Well, that was a weird month. It started with the Cubs winning the World Series and ended as the best month for pension sponsors this year. In-between, we had a presidential election with a surprising outcome. So…pensions. Both model pension plans we track1 enjoyed strong improvements in funded status during November – Plan A improved by 5% and Plan B by more than 1% last month – pushing both plans into positive territory for the year, up almost 1%.

Assets
Stocks were mostly up in November, but with lots of variation driven by strengthening of the US dollar. The S&P 500 was up more than 3% and NASDAQ gained more than 2%, but the small-cap Russell 2000 popped 11% last month, while the overseas EAFE index slipped almost 2%. For the year, the S&P 500 is up almost 10%, the NASDAQ is up more than 6%, the Russell 2000 is up almost 18%, and the EAFE index is down almost 2% through the first eleven months of the year.
A diversified stock portfolio gained 3%-4% during November and is now up 8% on the year.
Interest rates surged upward in the wake of the election, marking four consecutive months of rising rates since the all-time lows seen last summer. All stripes of bonds suffered losses in November, ranging from 3%-6%, with Treasuries and long-duration bonds seeing the biggest drops. For the year, bonds remain up 3%-5%, with longer duration bonds and corporate bonds enjoying the best results.
Overall, our traditional 60/40 portfolio gained more than 1% during November and is now up more than 6% so far this year. The conservative 20/80 portfolio lost 2% on the month, but remains up more than 5% through the first eleven months of 2016.
Liabilities
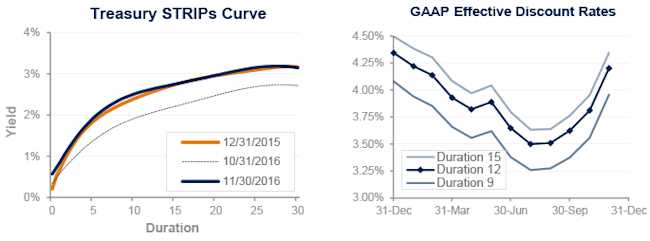
Pension liabilities (for funding, accounting, and de-risking purposes) are now driven by market interest rates. The graph on the left compares Treasury STRIPs yields at December 31, 2015 and November 30, 2016, and also shows the movement in rates last month. The graph on the right shows our estimate of movements in effective GAAP discount rates for pension obligations of various duration during 2016:

Interest rates jumped 0.4% during November, reducing pension liabilities by 3%-5%. Rates have moved sharply higher since the all-time lows seen this summer, leaving pension liabilities 5%-7% higher than at the end of 2015, with long duration plans seeing the biggest increases. Treasury rates have basically returned to levels prevailing at the end of 2015.
Summary
The surge in interest rates over the past four months has reduced pension liabilities by 5%-9% since July; at the same time, stocks have posted modest gains, allowing pension asset growth to overtake liability growth for the first time this year.
The graphs below show the movement of assets and liabilities for our two model plans this year:

Looking Ahead
Congress passed a budget in 2015 that includes a third round of pension funding relief since 2012. The upshot is that pension funding requirements over the next several years will not be appreciably affected by current low interest rates (unless these rates persist). Required contributions for the next few years will be lower and more stable than under prior law.
Discount rates surged 0.4% last month. We expect most pension sponsors will use effective discount rates in the 3.8%-4.5% range to measure pension liabilities right now.
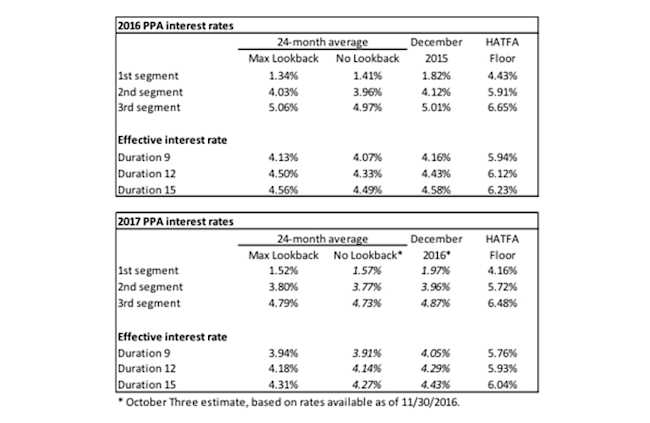
The table below summarizes rates that plan sponsors are required to use for IRS funding purposes for 2016, along with estimates for 2017. Pre-relief, both 24-month averages and December ‘spot’ rates, which are still required for some calculations, such as PBGC premiums, are also included.

1 Plan A is a traditional plan (duration 12 at 5.5%) with a 60/40 asset allocation, while Plan B is a cash balance plan (duration 9 at 5.5%) with a 20/80 allocation with a greater emphasis on corporate and long-duration bonds. For both plans, we assume the plan is 100% funded at the beginning of the year and ignore benefit accruals, contributions, and benefit payments in order to isolate the financial performance of plan assets versus liabilities.
