Pensions in 2013 – trend in interest rates and de-risking
Pensions in 2013 - trend in interest rates and de-risking
In this article we review recent trends in interest rates and their implications for 2013 DB funding and de-risking decisions.
Interest rates
Last summer we posted an article on How low can you go? Interest rates and DB plans. Summarizing: over the long-, medium- and short-term interest rates have been declining, precipitously during the period since August 2011, and those declines have put pressure on DB plan sponsors, significantly increasing both the cash and ‘earnings’ cost of their plans.
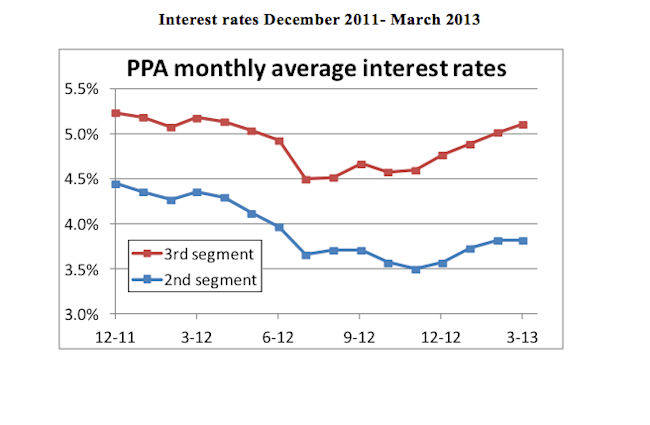
The following chart describes interest rate behavior (based on PPA’s monthly 2nd and 3rd segment rates) from the end of 2011 through March of 2013 (the second segment rate represents the rate in payments in years 5-20, while the third segment rate applies to payments after year 20.)

Obviously 15 months of data is too little to identify a trend, but clearly rates were lower last summer than they are now. Some think that late 2012 was the bottom – the end of a 30-year bull market in bonds.
“Pegging” rates for earnings, funding and de-risking
For GAAP accounting, the valuation interest rate is typically set based on December 31 spot rates. So, e.g., the rate for 2013 is based on the December 31, 2012 rates. 2013 rates are down from 2012 – typically in the range of 4.0%-4.5% as compared with 4.5%-5.0% at the end of 2011. (Note that the rates in the graph above aren’t strictly applicable for US GAAP purposes but, in our view, they provide an objective and reliable guide to current pension discount rates.)
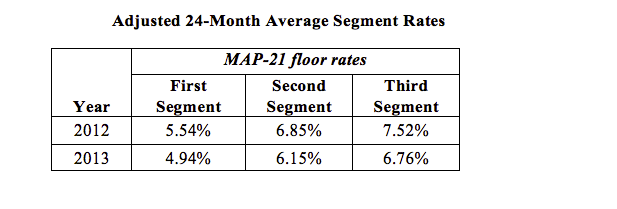
For funding, the determination of the applicable rate is based on averaging interest rates over an historical period – 24 months, with a floor on rates based on a 25-year average under MAP-21 relief. Keeping it simple (we have posted several detailed articles on the MAP-21 rates, including Implications of MAP-21 for DB plan finance), here are floor rates for last year (2012) and this year (2013).

The 2012-2013 decline in funding rates is similar to what we see for GAAP measurements. In this case, however, the drop has more to do with a reduction in the MAP-21 percentage floor (from 90% to 85% of the 25-year historical average) than the change in the 25-year average itself.
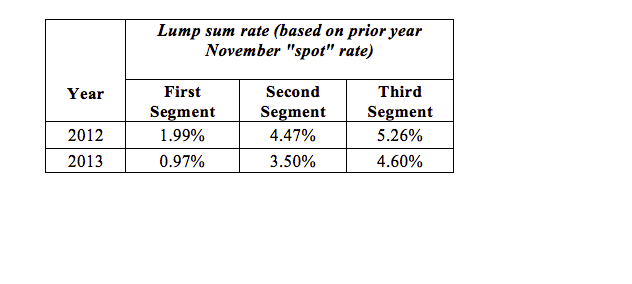
For de-risking, the critical rates are the rates used to calculate lump sums. Generally, those rates are ‘spot’ first, second and third segment rates for a designated month. Many sponsors set the lump sum rate at the beginning of the year, based on prior year November interest rates, so that participants will know what rate will be used to calculate their lump sum for the entire year. Here are lump sum rates for 2012 and 2013 calculated on that basis.

Declines in these rates are generally similar to what we see for GAAP purposes, which is not surprising considering they are both derived from more or less ‘current’ interest rates.
Implications for de-risking in 2013
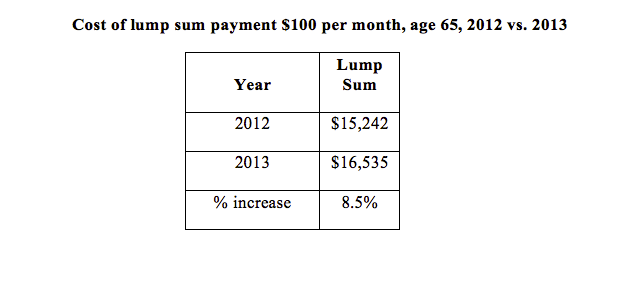
Lower interest rates for 2013 make it more expensive to de-risk (e.g., by paying a lump sum to a terminated vested participant) than last year. Consider below the lump sum value associated with settling an obligation of $100 per month to a 65 year old retiree in 2012 versus 2013.

Lump sum rates vs. accounting vs. funding vs. current rates
It’s worth noting a couple of points about how all these interest rate effects interact. For the most part, the ERISA lump sum rate and GAAP measurement rate will behave similarly. There are minor differences in timing (GAAP numbers reflect December 31 rates, while lump sums rely on a monthly average that ‘looks back’ 1-5 months.)
However, because lump sum rates are often ‘fixed’ for the year, changes in rates can create opportunities. For example, there is some evidence that the decline in rates during 2012 encouraged employers to enact ‘lump sum windows’ based on the higher rates prevailing in late 2011 for lump sums payable during 2012.
Similarly, right now, interest rates are higher than they were in November 2012. Looking at the first chart, PPA segment rates are 30-40 basis points higher now. If that doesn’t change (or rates go up further), then it will cost you less to pay lump sums in 2014 than in 2013.
On the other hand, a ‘lump sum cashout’ strategy is likely to reduce a plan’s FTAP under ERISA, because the ‘settlement rate’ is currently much lower than the rates used to measure liabilities under MAP-21.
Funding
We have discussed the issue of funding extensively elsewhere — most recently in our articles Pension Finance and MAP-21 Update and 2013 Pension Funding: Timing and Opportunities. As we have noted (see our article Budget Crises: Issues for Retirement Plans), extension of MAP-21relief may be one way to increase revenues without raising taxes. We note that the recent rise in interest rates may reduce some of the pressure for an extension of that relief.
* * *
We will continue to follow these issues.
