August 2019 Pension Finance Update
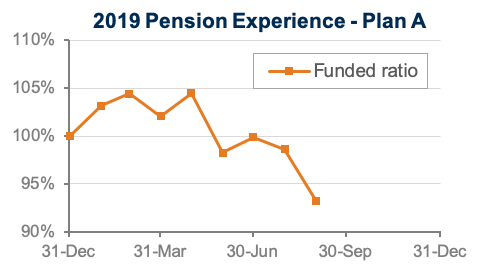
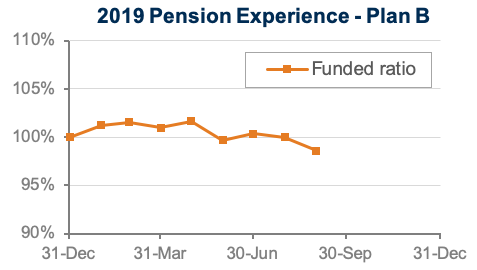
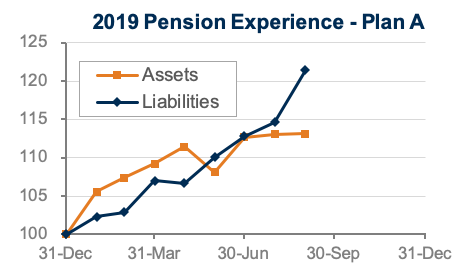
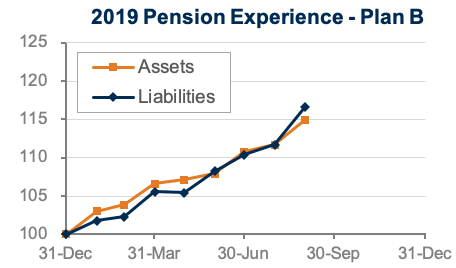
Falling stock markets and record-low interest rates combined to produce a brutal August for pension finances. Both model plans we track[1] lost ground last month, ending August at the low point for the year: Plan A lost more than 5% last month and is now down almost 7% for the year, while Plan B lost more than 1% and is now down 1% through the first eight months of 2019:
Assets
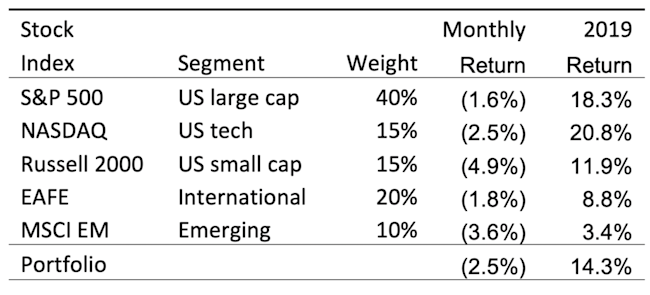
Stocks lost ground in August, but indexes other than emerging markets continue to show strong returns through the first eight months of 2019:
Treasury yields plunged more than 0.5% in August and corporate bond yields fell 0.4%, producing strong returns of around 4% for bonds during the month. For the year, bonds have earned 12%-16%, with long duration and corporate bonds performing best.
Overall, our traditional 60/40 portfolio was flat during August and remains up 13% so far this year, while the conservative 20/80 portfolio gained 3% last month and is up almost 15% during 2019.
Liabilities
Pension liabilities (for funding, accounting, and de-risking purposes) are driven by market interest rates. The graph on the left compares our Aa GAAP spot yield curve at December 31, 2018, and August 31, 2019, and it also shows the movement in the curve last month. The graph on the right shows our estimate of movements in effective GAAP discount rates for pension obligations of various duration during 2019:
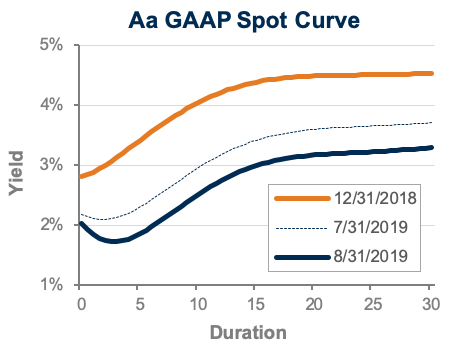
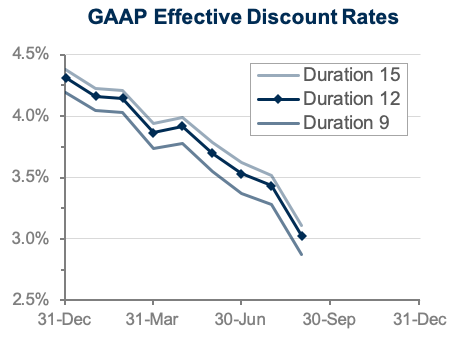
Corporate bond yields continued to plunge in August, hitting new all-time lows during the month. Pension liabilities increased 4%-6% in August and are now up an astounding 15%-25% for the year, with long duration plans seeing the largest increases.
Summary
Have rates hit bottom? Has the 37-year bull market in bonds – a source of so much pain for pension sponsors – finally run its course? Or do rates have further to fall, as we see in other developed economies? It’s impossible to say, but a world with 2% yields on 30-year Treasury bonds poses real difficulties for employers underwriting pension promises. The graphs below show the progress of assets and liabilities for our two model plans through the first eight months of 2019:
Looking Ahead
Pension funding relief has reduced required plan funding since 2012, but under current law, this relief will gradually sunset. Given the current level of market interest rates, it is possible that relief reduces the funding burden through 2028, but the rates used to measure liabilities will move significantly lower over the next few years, increasing funding requirements for pension sponsors that have only made required contributions.
Discount rates fell 0.4% last month, marking a new low for pension discount rates. We expect most pension sponsors will use effective discount rates in the 2.8%-3.2% range to measure pension liabilities right now.
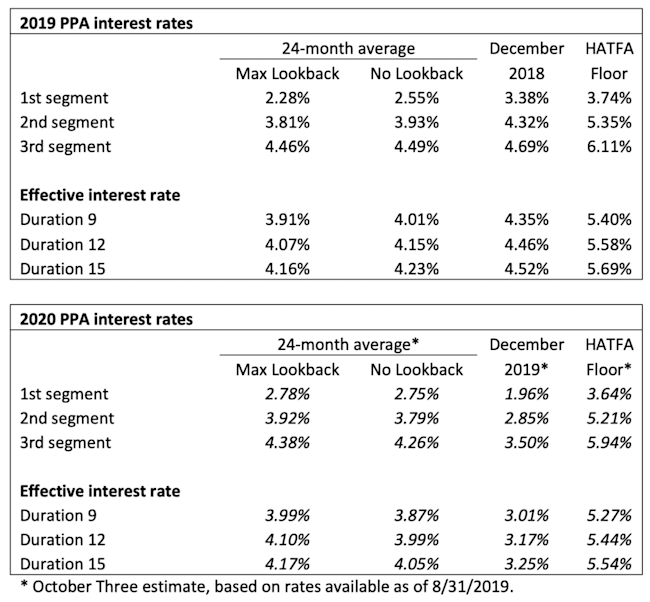
The table below summarizes rates that plan sponsors are required to use for IRS funding purposes for 2019, along with estimates for 2020. Pre-relief, both 24-month averages and December ‘spot’ rates, which are still required for some calculations, such as PBGC premiums, are also included.
[1]Plan A is a traditional plan (duration 12 at 5.5%) with a 60/40 asset allocation, while Plan B is a largely retired plan (duration 9 at 5.5%) with a 20/80 allocation with a greater emphasis on corporate and long-duration bonds. We assume overhead expenses of 1% of plan assets per year, and we assume the plans are 100% funded at the beginning of the year and ignore benefit accruals, contributions, and benefit payments in order to isolate the financial performance of plan assets versus liabilities.
