MAP-21 and DB plan finance – Looking ahead to 2014
MAP-21 and DB plan finance - Looking ahead to 2014
We have been posting articles regularly on the effect of the “Moving Ahead for Progress in the 21st Century Act” (MAP-21) interest rate floor on defined benefit plan funding. IRS recently published MAP-21 rates for 2014. This article briefly reviews the new rates and their implications for plan funding.
Background — valuations interest rates under the PPA and MAP-21
Currently there are three different interest rate methodologies that may be used to calculate plan liabilities for purposes of ERISA/Tax Code minimum funding rules.
1. 24-month average. Under the Pension Protection Act (PPA), valuation interest rates for a given
year are generally determined using a corporate bond yield curve, averaged over 24 months and broken down into three ‘segment rates’ – short-, medium- and long-term. The 24-month period used to determine PPA segment rates generally ends with the month immediately preceding the valuation month. So, for a calendar year plan, the 24-month period for the 2014 valuation ends December 2013. Sponsors may, however, alternatively elect to use one of the 4 months preceding that month. Thus, for the January 2014 valuation, a calendar year plan may use August, September, October, November or December 2013 as the “24th month” of the 24-month average.
2. Full yield curve. Alternatively, sponsors may use a ‘full yield curve’ (no segment rates) and ‘spot’
interest rates (actually the average of spot rates for one month) for the last month of the prior year – e.g., December 2013 for the January 2014 valuation.
3. 25-year average ‘floor.’ Under MAP-21, sponsors using 24-month segment rates (i.e., not using
‘spot’ rates) also get the benefit of an interest rate floor: interest rates can be no lower than (oversimplifying somewhat) the 25-year average of rates for a period ending with August of the calendar year preceding the calendar year in which the plan year begins. So, for plan years beginning in 2014, the 25-year averaging period ends, effectively, with August 2013.
Obviously this all gets a little confusing. PPA 24-month average segment rates depend on what ‘24th month’ period the sponsor picks (e.g., for calendar year plans, August, September, October, November or December). Thus sponsors with the same plan year (e.g., a calendar year) may be using different 24-month averages. But the MAP-21 rate is the same for everybody – the 25-year average ending (effectively) with August of the calendar year preceding the calendar year in which the plan year begins.
Because of this ‘year based’ treatment keying off of a 25-year average ending with August of the ‘prior year,’ we now know the 2014 MAP-21 ‘floor’ rate for all of 2014. We also know the 24-month average rate for plans using August or September as the ‘24th month.’ We do not know the 24-month average rate for 2014 for plans using October-December as the ‘24th month.’
MAP-21‘floor’ for 2014
The MAP-21‘floor’ segment rates are a function of the 25-year average discussed above and a percentage multiplier. Each year the 25-year average ‘moves forward’ one year. This generally results in a reduction of the floor because a very high interest rate year (from the late 1980s) is subtracted from the 25-year average, and a very low interest rate year (e.g., from 2013) is added. The floor also goes down because the percentage multiplier ‘phases down.’ In 2012 the percentage multiplier was 90%; in 2013 it was 85%; in 2014 it is 80%.
Thus, generally and as a result of both the ‘moving forward’ of the 25-year average and the ‘phase-down’ of the percentage multiplier, each year the MAP-21 floor goes down.
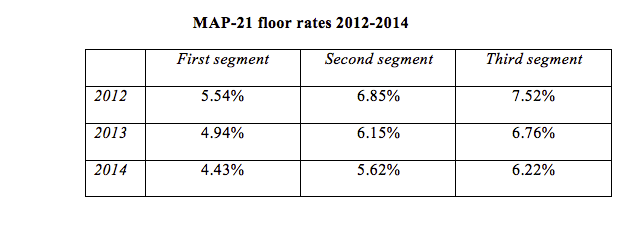
The chart below shows the MAP-21 floor rates for the years 2012-2014:

So – the MAP-21 floor for 2014 went down by about 50 basis points from the floor for 2013. The floor is, however, still providing significant relief in the form of higher interest rates than would otherwise apply under the PPA. The following chart compares the MAP-21 floor for 2014 with the 24-month segment rates that would otherwise be used for 2014 for a calendar year plan using August 2013 as the ‘24th month.’

For the key second (medium-term) and third (long-term) segment rates, MAP-21 is still providing significant interest rate relief in 2014: 157 basis points for the second segment and 115 basis points for the third segment. For a plan with typical demographics, for 2014 MAP-21 interest rate relief generally reduces the value (for minimum funding) of plan liabilities by 15%-20% (relative to the PPA rates that otherwise would apply).
We note also that, because of recent interest rate increases, the second and third segment ‘spot’ rates for August 2013 are around 50 basis points higher than the 24-month average rates for August.

* * *
We will continue to follow this issue.
