Retirement plan performance at mid-year 2021
A review of this year's asset and interest rate performance and their effect on DB plan funding and DC retirement income.
In this article we review 2021 performance of assets and interest rates and their effect on DB plan funding and DC retirement income.
Effect on DB funding
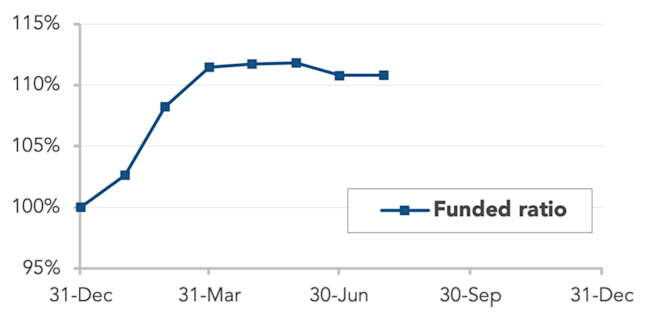
October Three’s July 2021 Pension Finance Update shows considerable 2021 gains in defined benefit plan funding over the first quarter, then a modest decline in the second quarter, with our model plan still up around 10% through July 12.
2021 Pension Experience (Duration 12, 60/40 Allocation)

A plan that was 90% funded at beginning of the year is now around 100% funded.
Effect on DC plans
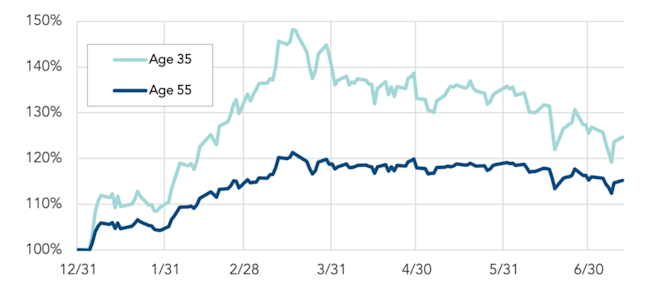
We have been tracking the relationship between a DC participant’s asset and (lifetime income) liability portfolios for more than a year now. To do this, we track the effect of asset gains/losses and interest rate increases/declines for two example participants (ages 35 and 55). The chart below illustrates how the retirement income of these participants has fared over the first part of 2021.
Age 65 Retirement Income % of BOY

This improvement is a result of increases in both stock markets and interest rates. This trajectory of values and rates represents something of a departure in results from the broad pattern of the last 10+ years.
In what follows, we unpack the moving parts of these funding/retirement income numbers and conclude with some practical observations about the current trend.
The retirement income funding equation
Saving for retirement involves accumulating “capital” in the form of savings plus earnings on savings and, in retirement, turning that capital accumulation into income in retirement. The simplest, lowest risk way to do that – to finance retirement income – is to buy that income as an annuity from an annuity carrier. Then, the challenge of turning (current) assets into (future) income is (in effect) outsourced to the annuity carrier, who then matches income-producing assets (typically bonds) against the income payment obligation it has committed to.
There is a “do it yourself” version of this, at least for defined benefit plans: invest in (something like) zero coupon bonds that pay out the income promised by the DB plan. This is called a liability driven investment (LDI) strategy, and its intent is to (in effect) hedge out interest rate risk.
Either of these simple and safe strategies involve converting savings to income based on current interest rates – either in the annuity market or the bond market.
The private system and the retirement income funding “bet”
The private pension/401(k) system in the US is premised on a kind of bet against that simple annuity solution: that sponsors (in the case of DB plans) or participants (in the case of defined contribution/401(k) plans) “saving and investing on their own” can produce more retirement income than the annuity system. Critically, because – unlike annuity carriers who are subject to relatively tight restrictions on what they can invest in – DB sponsors and DC participants can invest more broadly (particularly in equities) in a way that will (theoretically) outperform the bonds that the annuity carrier would use to fund pension liabilities.
Thus, at its simplest, the private retirement system is a bet on investment returns against interest rates, or more simply, stocks against bonds.
The returns vs. interest rate tradeoff
Nevertheless, in the end, retirement savers must reckon with interest rates. DB sponsors, of course, know this well, because under the FASB accounting regime they must book liabilities based (more or less) on current interest rates (“marking them to market”).
The situation of DC participants is more complicated but winds up in a similar place.
DC participants, unless they are independently wealthy, when they go to retire must be certain that they will have enough income to live on. Much has been made in this regard about longevity risk. We would also add, as a significant but unpredictable risk, the cost of long-term care. But in an era of declining interest rates, the meta-factor that participants have had to contend with is the increasing cost of income – as interest rates go down, you need more savings to produce the same amount of income.
And, in the relatively near future, DC participants will have their own sort of mark-to-market regime, as DC sponsors will have to begin reporting the retirement income their account balances can buy. The proposed interest rate to be used for this assets-to-income conversion is 10-year Treasury rates. If, next year or the year after, that rate drops (as it did in 2020) 100 basis points, the cost is likely to show up in significantly reduced retirement income estimates.
All of which is to say that, even if your stock portfolio has done well for the year, if interest rates go down enough, you may fall behind on your retirement income goal. DB sponsors know this well, based on their experience this century. For example, stocks posted double-digit returns in 2017, 2019, and 2020, but pension finances barely gained ground in these years because interest rates fell significantly during each year. 2018 shows the opposite result: stocks fell, but pension finances were stable because interest rates rose.
The correlation of interest rates and asset values
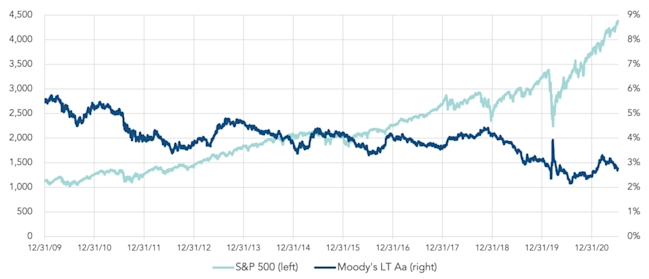
And retirement investors must also contend with the fact that often (possibly even most of the time) stock prices are correlated with interest rates. The major variables in company valuation are (1) expected earnings and (2) a discount rate (that is, an interest rate). That is certainly part of what has been happening since 2009.
S&P 500 vs. Moody’s Long-term Aa since 12/31/2009

A recent counter-trend
The “home run” here – for a DB plan sponsor and for a DC participant – is when stock values and interest rates go up. Because in that situation, the DB sponsor’s and DC participant’s asset ��“pile” has gotten bigger, while the cost of retirement income has gone down. This happy coincidence does not happen often. This century (and prior to 2021), only 2013 produced such a result, and 2013 was far and away the century’s best year for pension finance (and retirement finance generally).
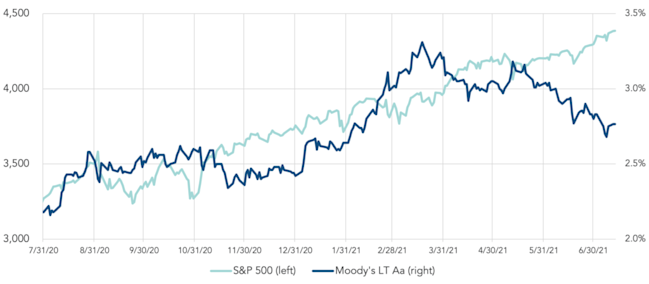
This “home run” scenario recurred between last July, when interest rates bottomed out, and March of 2021, when rates peaked.
S&P 500 vs. Moody’s Long-term Aa since 7/31/2020

The question, here at mid-year 2021, is whether this (relatively short term) trend will continue. As the chart above shows, rates have again moved lower since March.
Why all of this matters
Bringing this back from the abstract to the practical: In the first quarter 2021, we had that “home run” trend – increasing interest rates + increasing asset values – with some give back in the second quarter. If performance is flat for the rest of the year, then:
For financial disclosure, sponsors will show about a 10% improvement in funded status this year (PBO/Assets).
For minimum funding, more sponsors will be above the 80% benefit restriction level (which will allow more de-risking).
Most funding decisions, however, will still be driven by PBGC variable rate premium costs. In that regard, plans that pay variable premiums but are not at the VRP cap will have lower 2022 VRPs. And more plans will not be at the cap.
For many plans, de-risking via lump sums (typically valued based on end-of-prior-year interest rates) will be cheaper next year than it will be this year. De-risking via annuities (valued at current book) will be cheaper this year than it was last year, but the big question for sponsors considering annuitization will be the direction of future interest rates.
DC participants will see an increase in the retirement income their account balance can buy, both because their account balance has (typically) gotten bigger and because interest rates (and the cost of annuity income) has gone down vs. last year.
The key factors to watch
The question for the rest of the year is the relationship of changes in interest rates vs. changes in asset values. Oversimplifying:
Higher rates + higher stock values = improvement (see 2013)
Lower rates + higher stock values = stable (see 2017, 2019, 2020)
Higher rates + lower stock values = stable (see 2018)
Lower rates + lower stock values = a decline in funding/retirement income (see 2011 or, more spectacularly, 2008 or 2000-2002)
One obvious caveat: the relative amount of change in all this matters. The effect of a dramatic increase in stock values may dwarf the effect of a modest decline in interest rates. Similarly, a dramatic decline in interest rates may dwarf the effect of a modest increase stock values.
* * *
We will continue to follow this issue.
