Cash Balance Plan Design
Learn how a Market based crediting rate can add pension stability to your cash balance plan design.
Creating Pension Stability in a Volatile World

It seems almost everyone in the retirement industry is writing about cash balance plan design these days — from actuaries to investment managers to third–party administrators. All agree they are a great way to create additional income deferral for business owners in professional service firms and other owner-operated businesses. High contribution limits, design flexibility and ease of understanding are among the features that make these plans great fits.
However, one of the most important aspects of a great cash balance plan design lies hidden in how the Interest Crediting Rate (ICR) is defined. A clear trend has emerged, especially among the country’s top law firms, surrounding the use of a Market Based crediting rate for this purpose. Under this type of cash balance plan design, participant accounts are credited with the actual return on plan assets, rather than a stipulated rate based on an external index (an Index Based crediting rate). The driving force behind this trend is the ability to create more stable year to year contribution patterns for business owners, especially as the plan matures.
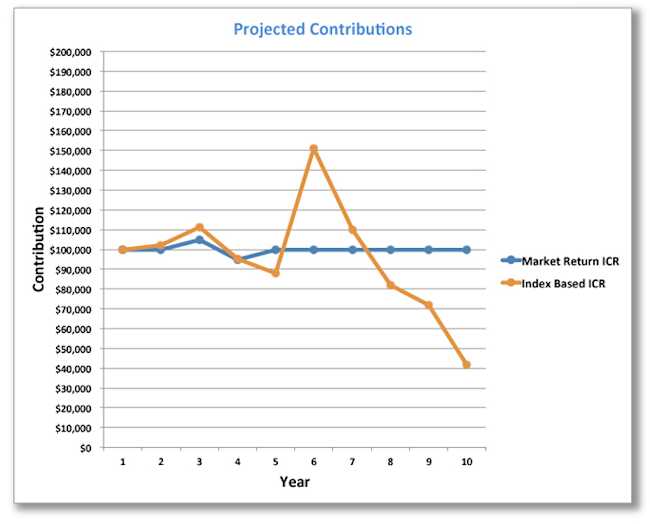
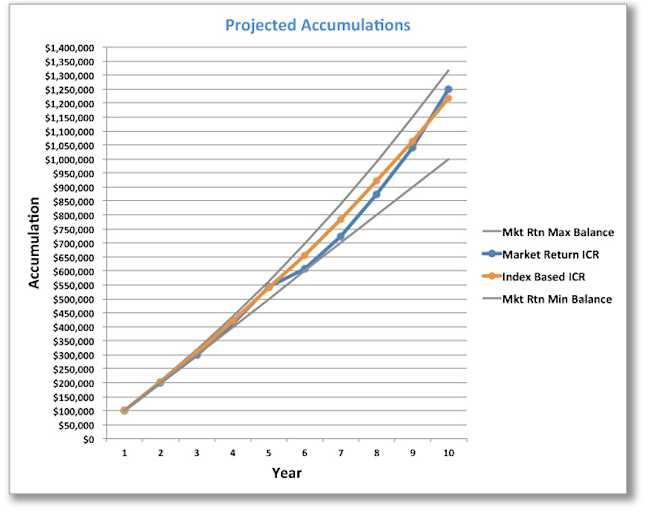
Consider the following illustrations, which compare hypothetical annual contribution requirements and projected accumulations over a 10–year period. These accumulations are under two plans that are identical except for the Interest Crediting Rate. In this example, the Index is the 30–year treasury rate (a common choice among non-market based cash balance plan design) and the actual returns are based on historical data reflecting a hypothetical portfolio (invested 80% in fixed income and 20% in equities). All yield data is from 2002 to 2012, only in reverse, with the bond portfolio returns calculated to reflect the change in rates from 2011.


It’s evident that both designs get the participant to roughly the same place after 10 years, but with wildly different contribution patterns. Which would most partners rather budget for, a cash outlay that could vary from $40,000 to $150,000 over several years or one that rarely strays from the intended $100,000 contribution? This shows why so many firms are quickly moving to this design enhancement.
Which would most partners rather budget for, a cash outlay that could vary from $40,000 to $150,000 over the span of several years, or one that rarely strays from the intended $100,000 contribution?
The explanation for these two very different patterns is simple. On the Projected Accumulations graph, the results under both designs are contained by an ever–widening “corridor” (the solid gray lines). These lines represent minimum (imposed by law on all cash balance plans) and maximum (imposed by design on the Market based plan). These are cumulative returns of 0% to 6% compounded annually. As long as the cumulative earnings of the cash balance plan design are within this corridor, no contribution adjustments are required under the Market Based ICR. Under the Index Based ICR, any deviation of actual earnings from the stipulated rate requires an adjustment to the contribution for the year to keep the plan on track.
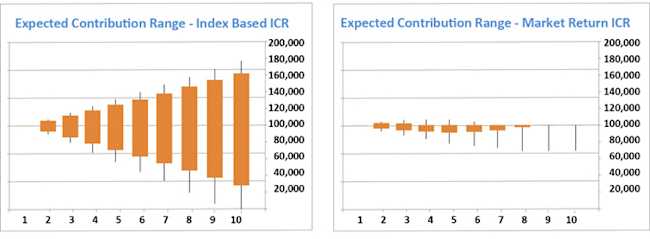
This causes the Market Based ICR design to produce increasing contribution stability as the plan matures due to this ever–widening corridor. Meanwhile, the Index Based ICR design produces increasing contribution volatility due to the need for actual earnings to match the index against a continually growing asset base. The following graphs further illustrate this point based on 10,000 trials of randomly generated investment returns over the 10-year period. The Index is the 30–year treasury rate but for simplicity is assumed to remain constant at 3.5% throughout. Actual yearly returns reflect a median value of 4% and a range of -4% to +14%.

Results are hypothetical, but these returns are generally representative of a portfolio composed of 80% fixed income and 20% equity investments.
The solid portion on each graph represents the results of 80% of the outcomes over the 10 year period while the thin vertical lines extend the range to 95% of the outcomes.
At this point, you might ask “Doesn’t this make a cash balance plan design look and feel a lot like a defined contribution plan?” Well…in many ways it does. Of course, participants still don’t have individual investment control, but the expectations around contributions and account balances are very similar and consistent between the two basic plan types. And, isn’t that precisely the objective? With the proper technology platform, participant accounts can be updated to reflect market performance with almost any frequency, even daily.

With the proper technology platform, participant accounts can be updated to reflect market performance with almost any frequency, even daily.
If your cash balance plan is still using an Index Based ICR we encourage you to explore the advantages a change to a Market Based ICR can bring to your firm and its partners. And, the good news is the change is pretty simple to implement. Contact October Three for additional information.
Explore the advantages a change to a Market Based ICR can bring to your firm and its partners.**Discover a** cash balance plan design that provides you with design flexibility and pension stability. At October Three:
We specialize in market-based interest credits to help control volatility.
Get design solutions that fit the urgent needs of today and tomorrow.
Gain a partner that mitigates risk, manages costs, and delivers real value.
Contact us for additional information.
