Markets 2020 – effect on DC plan participants – assets, interest rates, and retirement income
Many plan sponsors’ funding policy – and the response to current interest rate and asset declines – is likely to be framed with a view to reducing so far as possible PBGC variable-rate premiums. For most plans, 2021 PBGC variable-rate premiums are going up significantly – for a $100 million plan, next year's premium could jump around $500,000.
In this article we update our analysis on the effect of 2020 asset and interest rate markets on defined contribution plan retirement income. We begin with a brief review of our methodology.
Background – calculating DC retirement income
As we discussed in our article Interest rates 2019 – the effect of recent declines on DC plans, if we assume (as is generally the case) that the purpose of 401(k) savings is to provide income in retirement, then both gains/losses on the participant’s account balance and increases/declines in interest rates will affect the “funded status” of the participant’s retirement income target.
The effect of asset gains/losses is obvious. The effect of interest rate increases/declines is less intuitive. In effect, interest rate declines represent an increase in the cost of retirement income; interest rate increases represent a decrease in that cost. Simple version: when interest rates go down, annuity income gets more expensive.
Mandatory lifetime income disclosure – adopted in the SECURE Act – is intended to make this relationship explicit, generally requiring annual disclosure of the amount of retirement income (joint/single life annuity) a participant’s defined contribution account can buy.
Example participants
To understand how the markets are affecting DC retirement income, we have been considering two example participants: (1) a 35-year old invested in a 2050 target date fund (TDF), and (2) a 55-year old invested in a 2030 TDF.
We model the lifetime income that these two example participants can buy, given changes in asset values – in our example, our 55-year old’s 2030 TDF and the 35-year old’s 2050 TDF – and in market interest rates.
We start the year, for each participant, with an assumption that the participant has enough DC assets to finance a $1,000 per month annuity at age 65. We then, as the year progresses, adjust that $1,000 per month figure to reflect gains/losses in asset values in the participant’s hypothetical account balance and the effect of increases/declines in interest rates on the cost of retirement income.
Effect of market volatility on DC lifetime income as of mid-July 2020
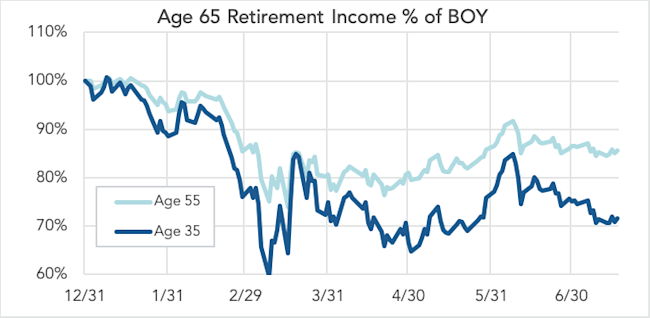
Using that methodology, here is where we are through July 17, 2020.

As the chart indicates, the amount of retirement income our age 55 participant can buy with his account balance has gone down 14% since the beginning of the year, and the amount of retirement income our age 35 participant can buy with her account balance has gone down 28%.
The point of this exercise – the role of interest rates in retirement income
The reason that tracking this number – the effect on net retirement income of changes in asset values and interest rates – is critical is the need to make explicit the role of interest rates in DC retirement planning. The TDFs we’re following are basically flat for the year. The net loss in retirement income for both example participants is at this point entirely attributable to the significant decline in interest rates – around 75 basis points – so far this year.
We note that it’s the 35 year old who has experienced the biggest 2020 decline in “retirement income value.” And it is fair to ask, do interest rates matter to a 35 year old, who won’t need to turn her account balance into income for another 30 years? After nearly 40 years of interest rate declines, there are those who would argue that “interest rates always matter.”
And, indeed, to the extent that, e.g., stock market value is simply the discounted value of future income streams, the amount of the future income a participant’s assets will produce is (arguably) more relevant than their current “discounted value” (represented by their share price).
That said, the 14% decline in the 55 year old’s anticipated retirement income is non-trivial and a more urgent fact. As participants approach retirement they begin (intuitively) to think in terms of income (and expenses) rather than the size of their asset pile.
Emerging stability?
Finally, we note that, as the chart indicates, the second quarter has been considerably more stable than the first. It will be interesting to see whether we are entering a (longer) period of stability (AKA a “new normal”).
* * *
We intend to update this analysis at least once a quarter.
